
What is a social media report?
A social media report is where you gather data and make sense of it. It pulls numbers from your social media channels so you can see how your social media efforts are actually performing and whether they support your business objectives.
Good social media reporting follows a simple flow:
- The goal
- The key performance indicators you’re tracking
- What changed
- Why it changed
- What you’ll do next
Without this structure, you’re just looking at raw data. With it, you can extract actionable insights that guide your social media strategy.
You can tailor your social media analytics report around the key social media metrics that match your goal. For example, if your focus is brand awareness, your report might include:
- Reach
- Impressions
- Engagement rate
- Shares across your social media platforms
Let’s make that concrete.
During your last reporting period, reach increased by 18 percent, but shares stayed the same. That tells you your content is being seen, but not passed along. In response, you might test stronger opening lines, clearer value in the caption, or content formats that encourage interaction to improve engagement metrics.
A strong social media report helps social media managers analyze it, identify trends, and adjust their strategy to improve performance and drive real social media ROI.
What are the main types of social media reports?
Your social media reporting should reflect your goals, reporting frequency, and overall marketing strategy. While every business customizes its social media analytics report differently, most reports fall into seven main categories.
Each type of report serves a specific purpose, supports different business objectives, and helps social media managers make better decisions.
1. Social media performance reports
A social media performance report gives you a broad view of how your social media efforts are performing over a specific time frame. It focuses on overall performance across your social media platforms rather than a single campaign or tactic.
Use this report for monthly reports or quarterly reports when updating stakeholders on marketing performance.
This report helps you decide:
- Which content types to prioritize
- What to adjust in your content strategy
- Whether your social media strategy is moving you toward your goals
Key metrics to include:
- Engagement rate: The percentage of people who interacted with your social media posts compared to those who saw them
- Reach: The number of unique users who saw your content
- Impressions: The total number of times your content was displayed
- Follower growth: The increase in follower count during a set reporting period
- Click-through rate (CTR): The percentage of users who clicked a link after seeing your post
- Conversion rate: The percentage of users who completed a desired action, such as a purchase or sign-up
2. Organic and paid campaign-specific social media reports
Campaign reports focus on the performance of a marketing initiatives, whether organic or paid. While they often track similar social media metrics, the interpretation differs.
Use this type of report weekly during active launches or major social media campaigns.
This report helps you decide:
- Whether to scale ad spend
- Whether creative assets need adjustments
- If audience targeting should change mid-campaign
Key campaign metrics to include:
- Engagement rate by type (organic vs. paid)
- Reach and impressions by type
- Click-through rate by type
- Conversion rate by type
- Cost per click (CPC) and cost per acquisition (CPA) for paid campaigns
These performance metrics are essential for evaluating social media ROI and optimizing campaign results in real time.
3. Competitive social media analytics reports
Competitive reports compare your social media performance against industry peers across social media networks.
Use this report monthly or quarterly for competitive benchmarking.
This report helps you decide:
- Whether your posting frequency is competitive
- How your engagement metrics compare
- Which content formats competitors succeed with
Key metrics to include:
- Share of voice (your brand mentions compared to competitors)
- Engagement metrics compared to competitors
- Follower growth comparison
- Posting frequency and content type comparison
This type of social media analytics report helps you identify trends and uncover valuable insights about your position in the market.
4. Social media listening reports
Social media listening reports focus on conversations happening around your brand across social media channels.
Use this report during product launches, PR-sensitive periods, or when monitoring brand reputation.
This report helps you decide:
- Whether messaging needs clarification
- If there are emerging risks
- What topics resonate most with your target audience
Key metrics to include:
- Volume of brand mentions
- Sentiment analysis (positive, negative, neutral tone of mentions)
- Trending topics and hashtags
- Influencer mentions and their impact
Using social listening tools improves data collection and gives you qualitative insights that standard performance reports may miss.
5. Social media influencer reports
Influencer reports evaluate how creators contribute to your social media performance and marketing strategies.
Use this report after a collaboration ends or mid-campaign to assess effectiveness.
This report helps you decide:
- Whether to renew a partnership
- If the influencer brief needs adjustment
- Which creators drive the strongest engagement rate or conversions
Key metrics to include:
- Engagement rate on influencer content
- Reach and impressions generated
- Conversion rates from influencer traffic
- Audience growth driven by the collaboration
This type of reporting connects influencer efforts directly to business outcomes.
6. Audience demographics and insights reports
Audience reports focus on who engages with your social media accounts and how they behave.
Use this report quarterly or when refining your content strategy.
This report helps you decide:
- Whether to shift your content mix
- If posting times need adjustment
- Whether your messaging aligns with audience behavior
Key metrics to include:
- Age, gender, and location distribution
- Interests and behaviors
- Device usage
- Most active days and times
Understanding audience demographics allows social media managers to align content more closely with their target audience and improve overall social performance.
7. Platform-specific social media reports
Since every social media platform performs differently, platform-specific reports help you understand where your social media efforts generate the strongest returns.
For example, a global survey of digital marketers in October 2024 found that Facebook was most often cited as delivering the highest ROI (28%), followed by Instagram (22%) and YouTube (12%). This reinforces the importance of analyzing performance metrics separately for each channel.
Use these reports when optimizing individual social channels or testing new formats.
This report helps you decide:
- Which features to prioritize per platform
- How content should differ across marketing channels
- Whether certain social media platforms deserve more investment
Key metrics to include:
- Platform-specific engagement, such as saves on Instagram or reposts
- Demographic details per platform
- Unique interactions, such as story replies or direct messages
- Platform-specific reach and impressions
These reports provide deeper insight than cross-channel reporting alone and allow you to tailor your social media management approach for each network.
What to include in a social media report
A well-built social media report should follow a logical order. Instead of jumping between metrics, organize your social media data the same way your team reviews performance.
Our free social media audit template follows this exact structure to make reporting easier and more actionable. All the examples you’ll find are from our downloadable template, which you can get and adjust for your own strategy.
Here’s how to build your report step by step.
1. Overall account performance
Start with a snapshot of your social media performance for the selected reporting period.
![Social media performance report template titled “Overall account performance for [PLATFORM]” with sections for number of posts, followers gained or lost, impressions, likes, comments, shares, clicks, and website traffic, alongside a “Top performing post” example and space for key takeaways.](https://socialbee.com/wp-content/uploads/2026/02/overall-account-performance.webp)
Include:
- Number of posts published
- Followers gained or lost
- Impressions
- Likes, comments, and shares
- Clicks and traffic to website
- Your top-performing post
This section gives stakeholders a quick overview of your social media efforts across each platform before diving deeper into social media analysis.
2. Performance comparison
Next, compare results to the previous reporting period.
![Monthly social media performance comparison template for [PLATFORM] showing follower growth, reach, and engagement metrics, including followers gained and lost, likes, comments, shares, clicks, month-over-month comparisons, and growth rate fields.](https://socialbee.com/wp-content/uploads/2026/02/monthly-performance-comparison.webp)
Track:
- Follower growth rate
- Changes in reach
- Changes in engagement metrics
- Changes in clicks
Comparing periods helps you identify trends and understand whether your social media strategy is improving over time or losing momentum.
3. Organic vs paid performance
If you’re running ads, separate organic and paid results clearly.
![Social media analytics template titled “Organic vs paid performance for [PLATFORM]” comparing paid and organic metrics, including reach, impressions, engagement, follower growth, click-through rate, conversion rate, and space for key takeaways.](https://socialbee.com/wp-content/uploads/2026/02/organic-vs-paid-performance.webp)
Include:
- Reach and impressions by type
- Engagement rate by type
- Click-through rate
- Conversion rate
- Follower growth
- Cost per click and cost per acquisition for paid campaigns
This section helps you evaluate social media ROI and decide whether to scale, adjust, or pause paid campaigns.
4. Social media listening and engagement
Numbers alone do not tell the full story. This section focuses on audience behavior and brand perception.
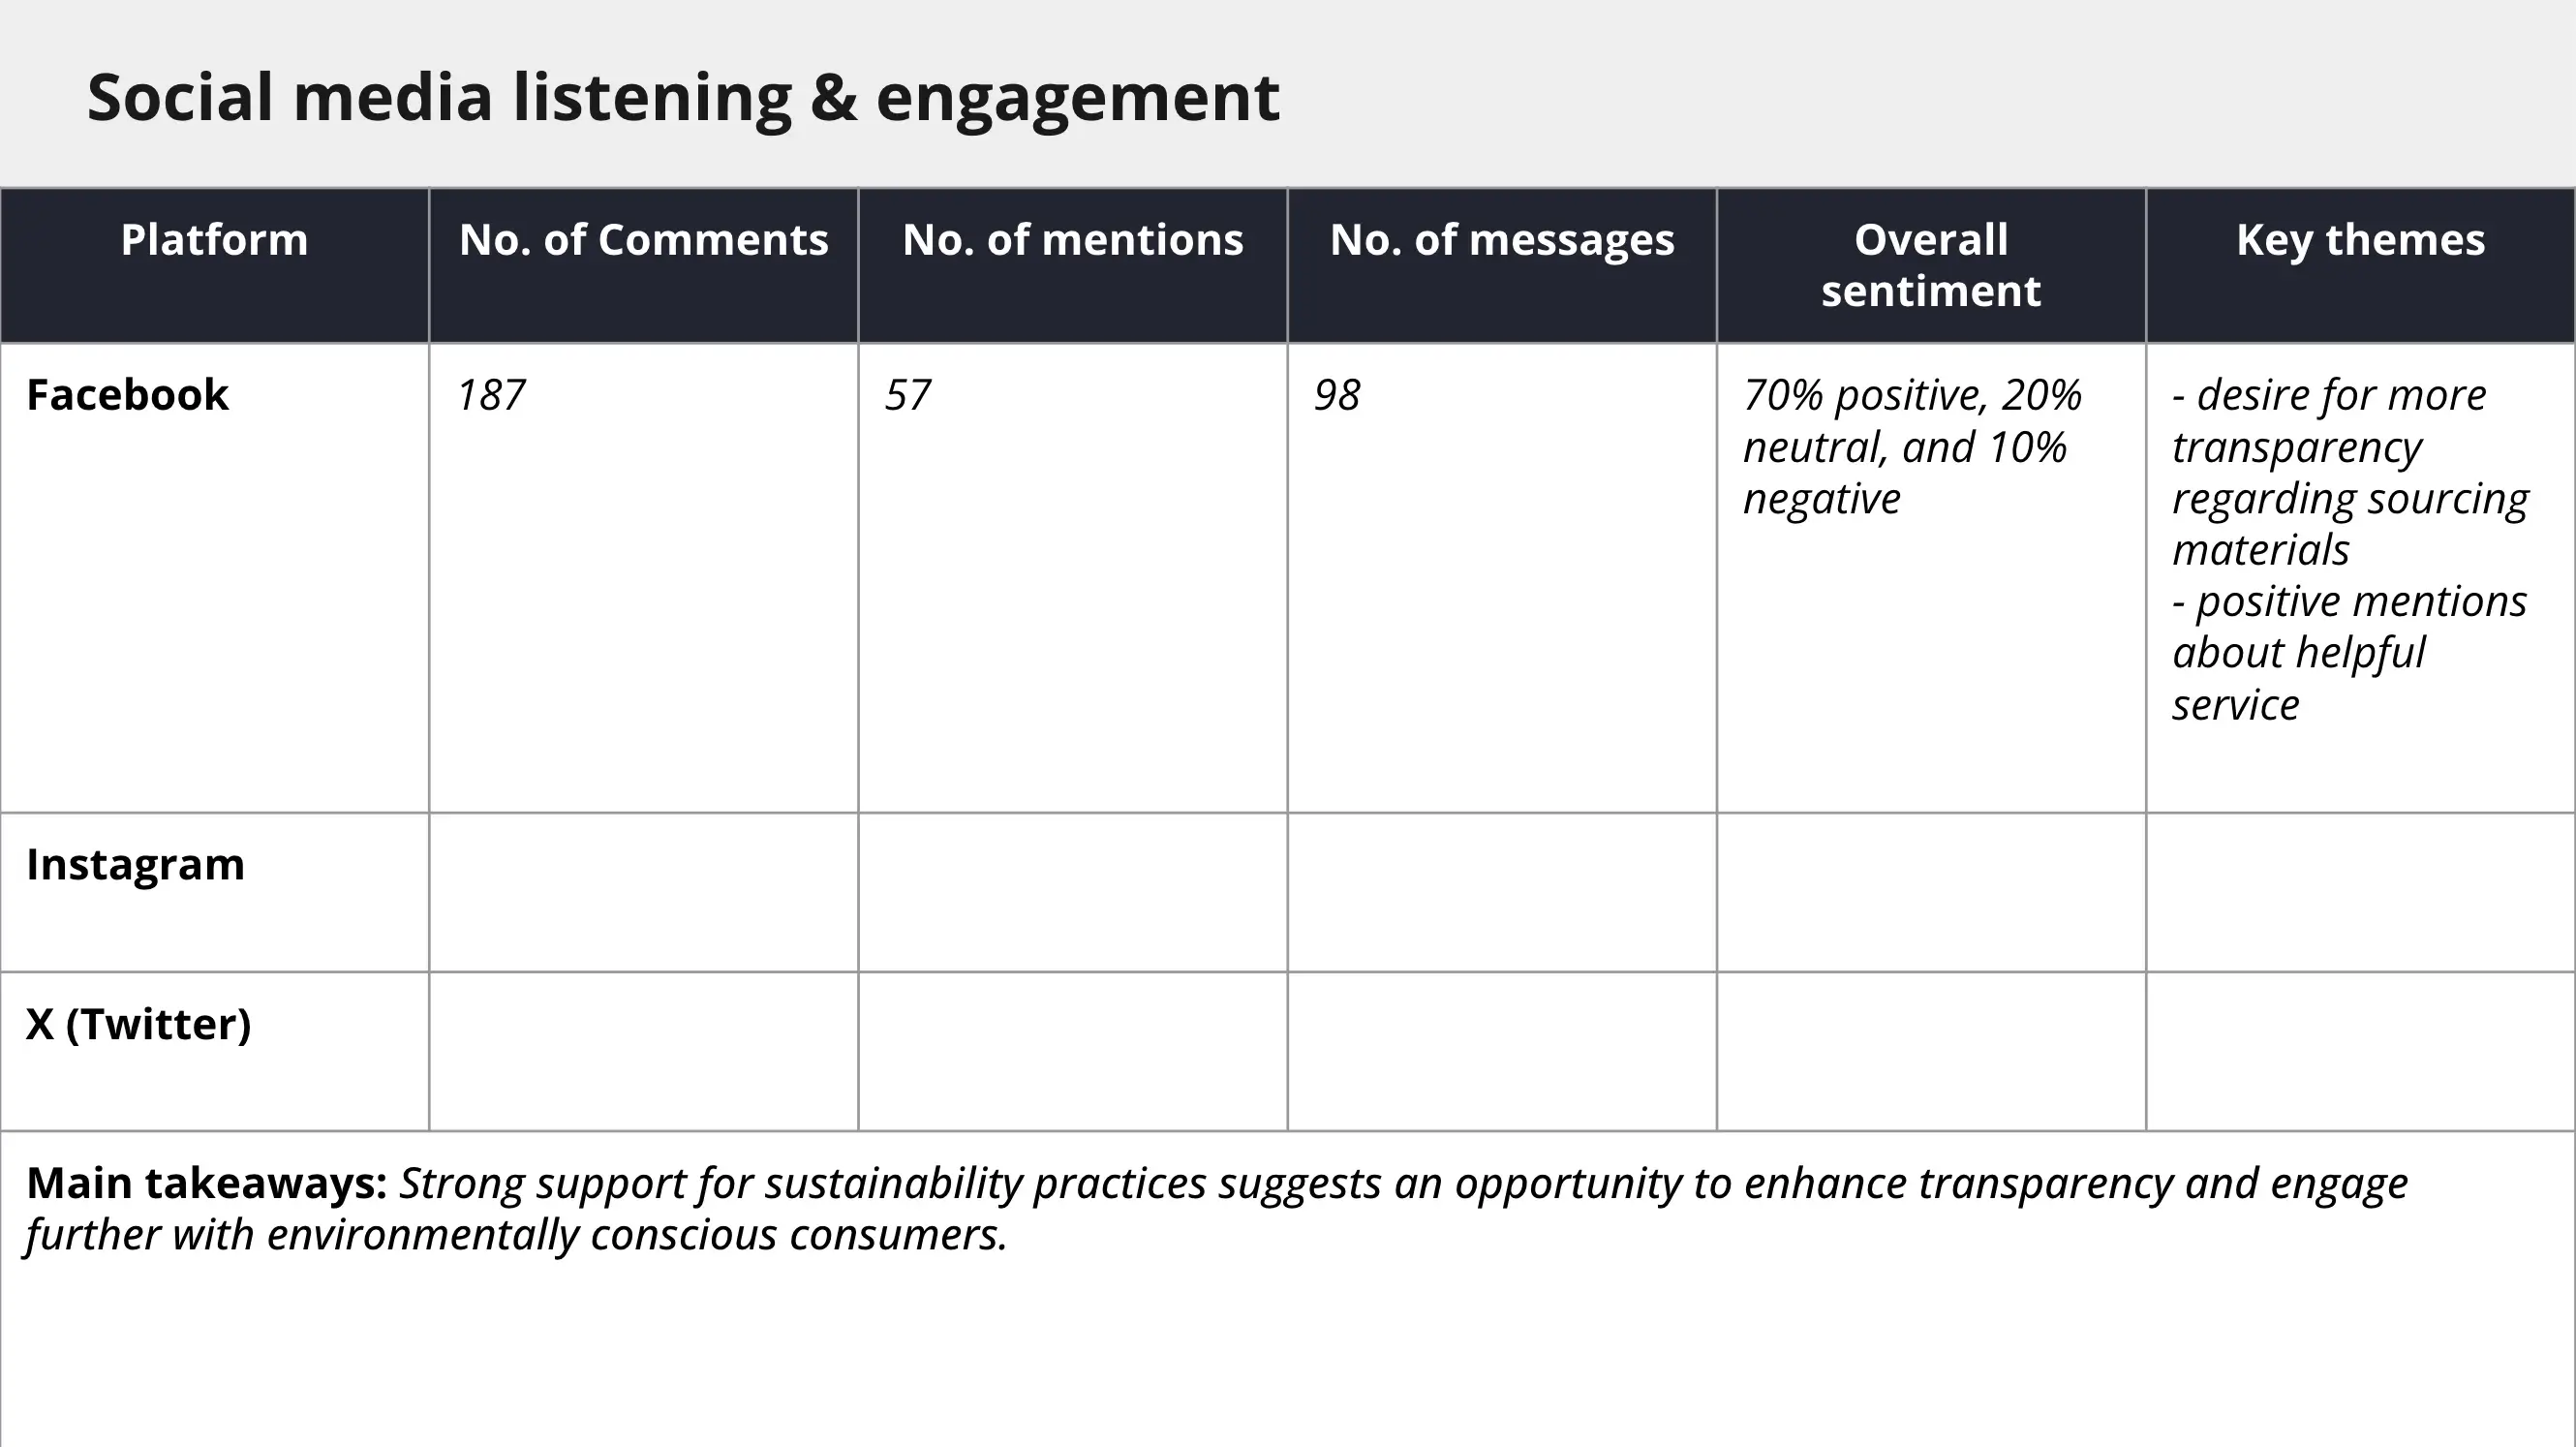
Track:
- Number of comments
- Number of brand mentions
- Number of direct messages
- Overall audience sentiment
- Key themes emerging in conversations
Social listening provides qualitative insights that help you spot industry trends, address concerns early, and refine messaging.
5. Competitor analysis
Context matters. Comparing your campaign performance to industry peers strengthens your competitive benchmarking efforts.
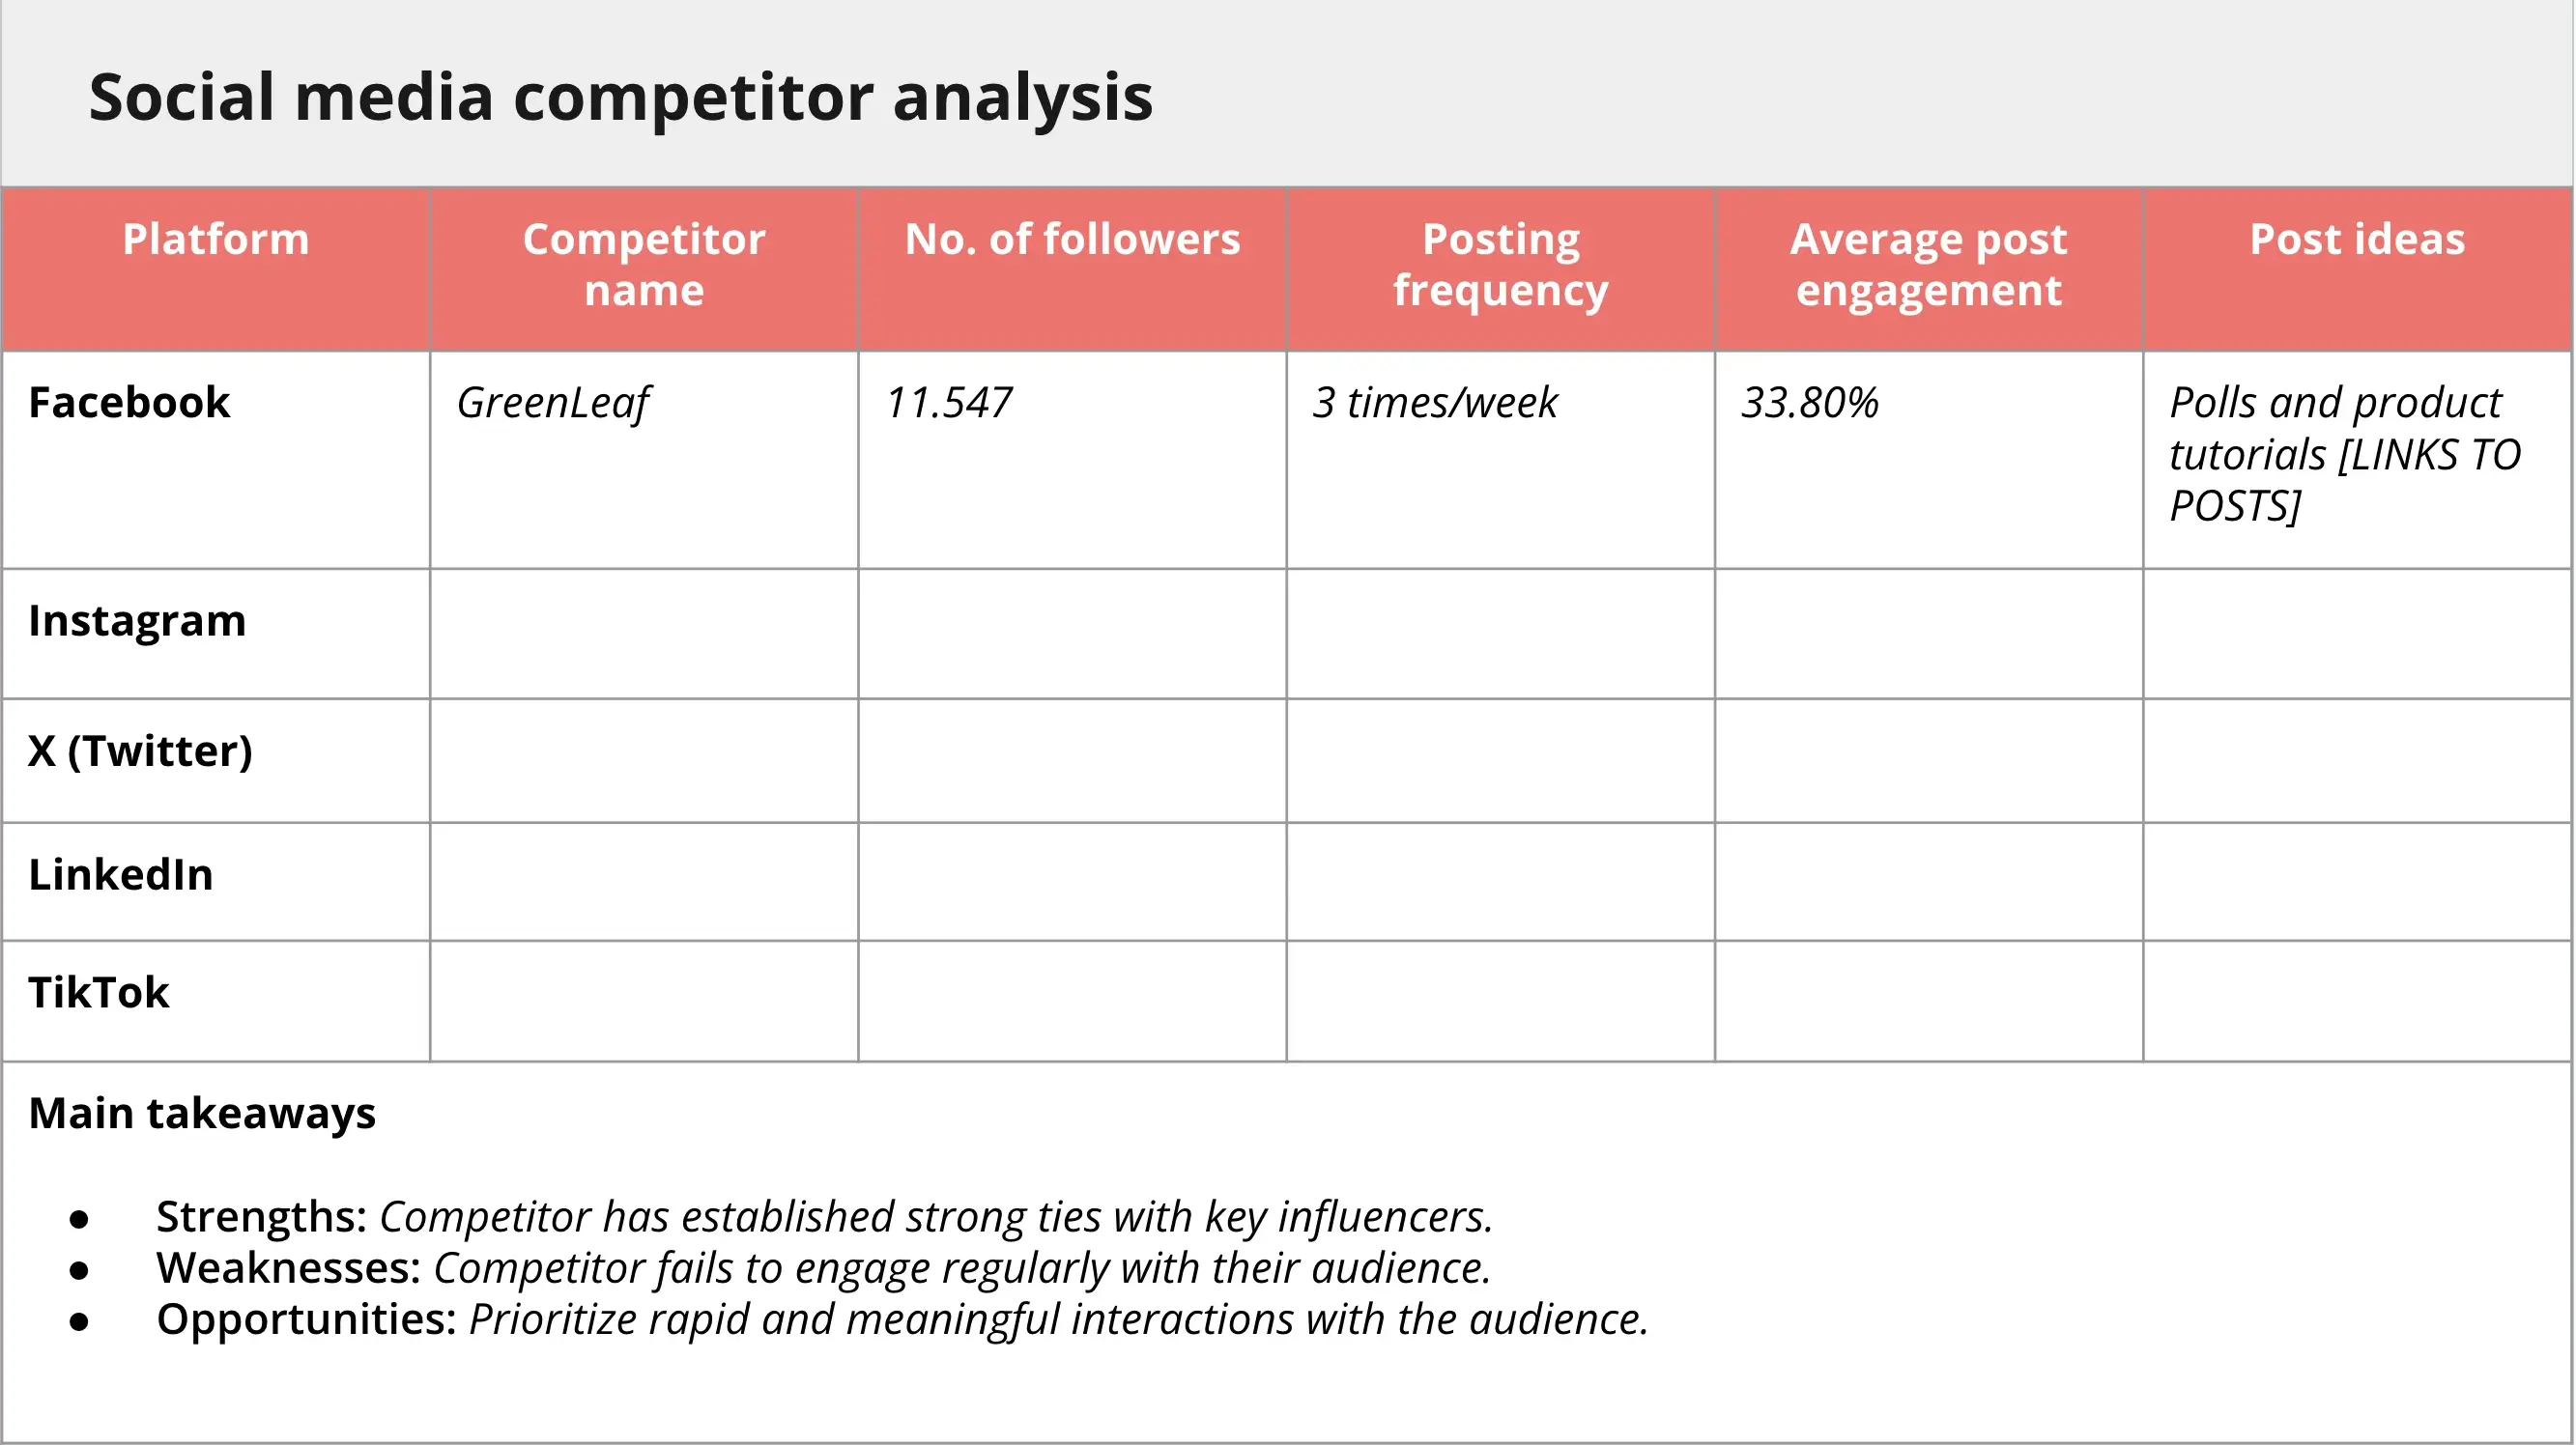
Include:
- Competitor follower count
- Posting frequency
- Average post engagement
- Content ideas or formats they use
This section helps you identify gaps, opportunities, and areas where your marketing campaigns can stand out.
6. Audience demographics
Understanding your target audience improves your content strategy.
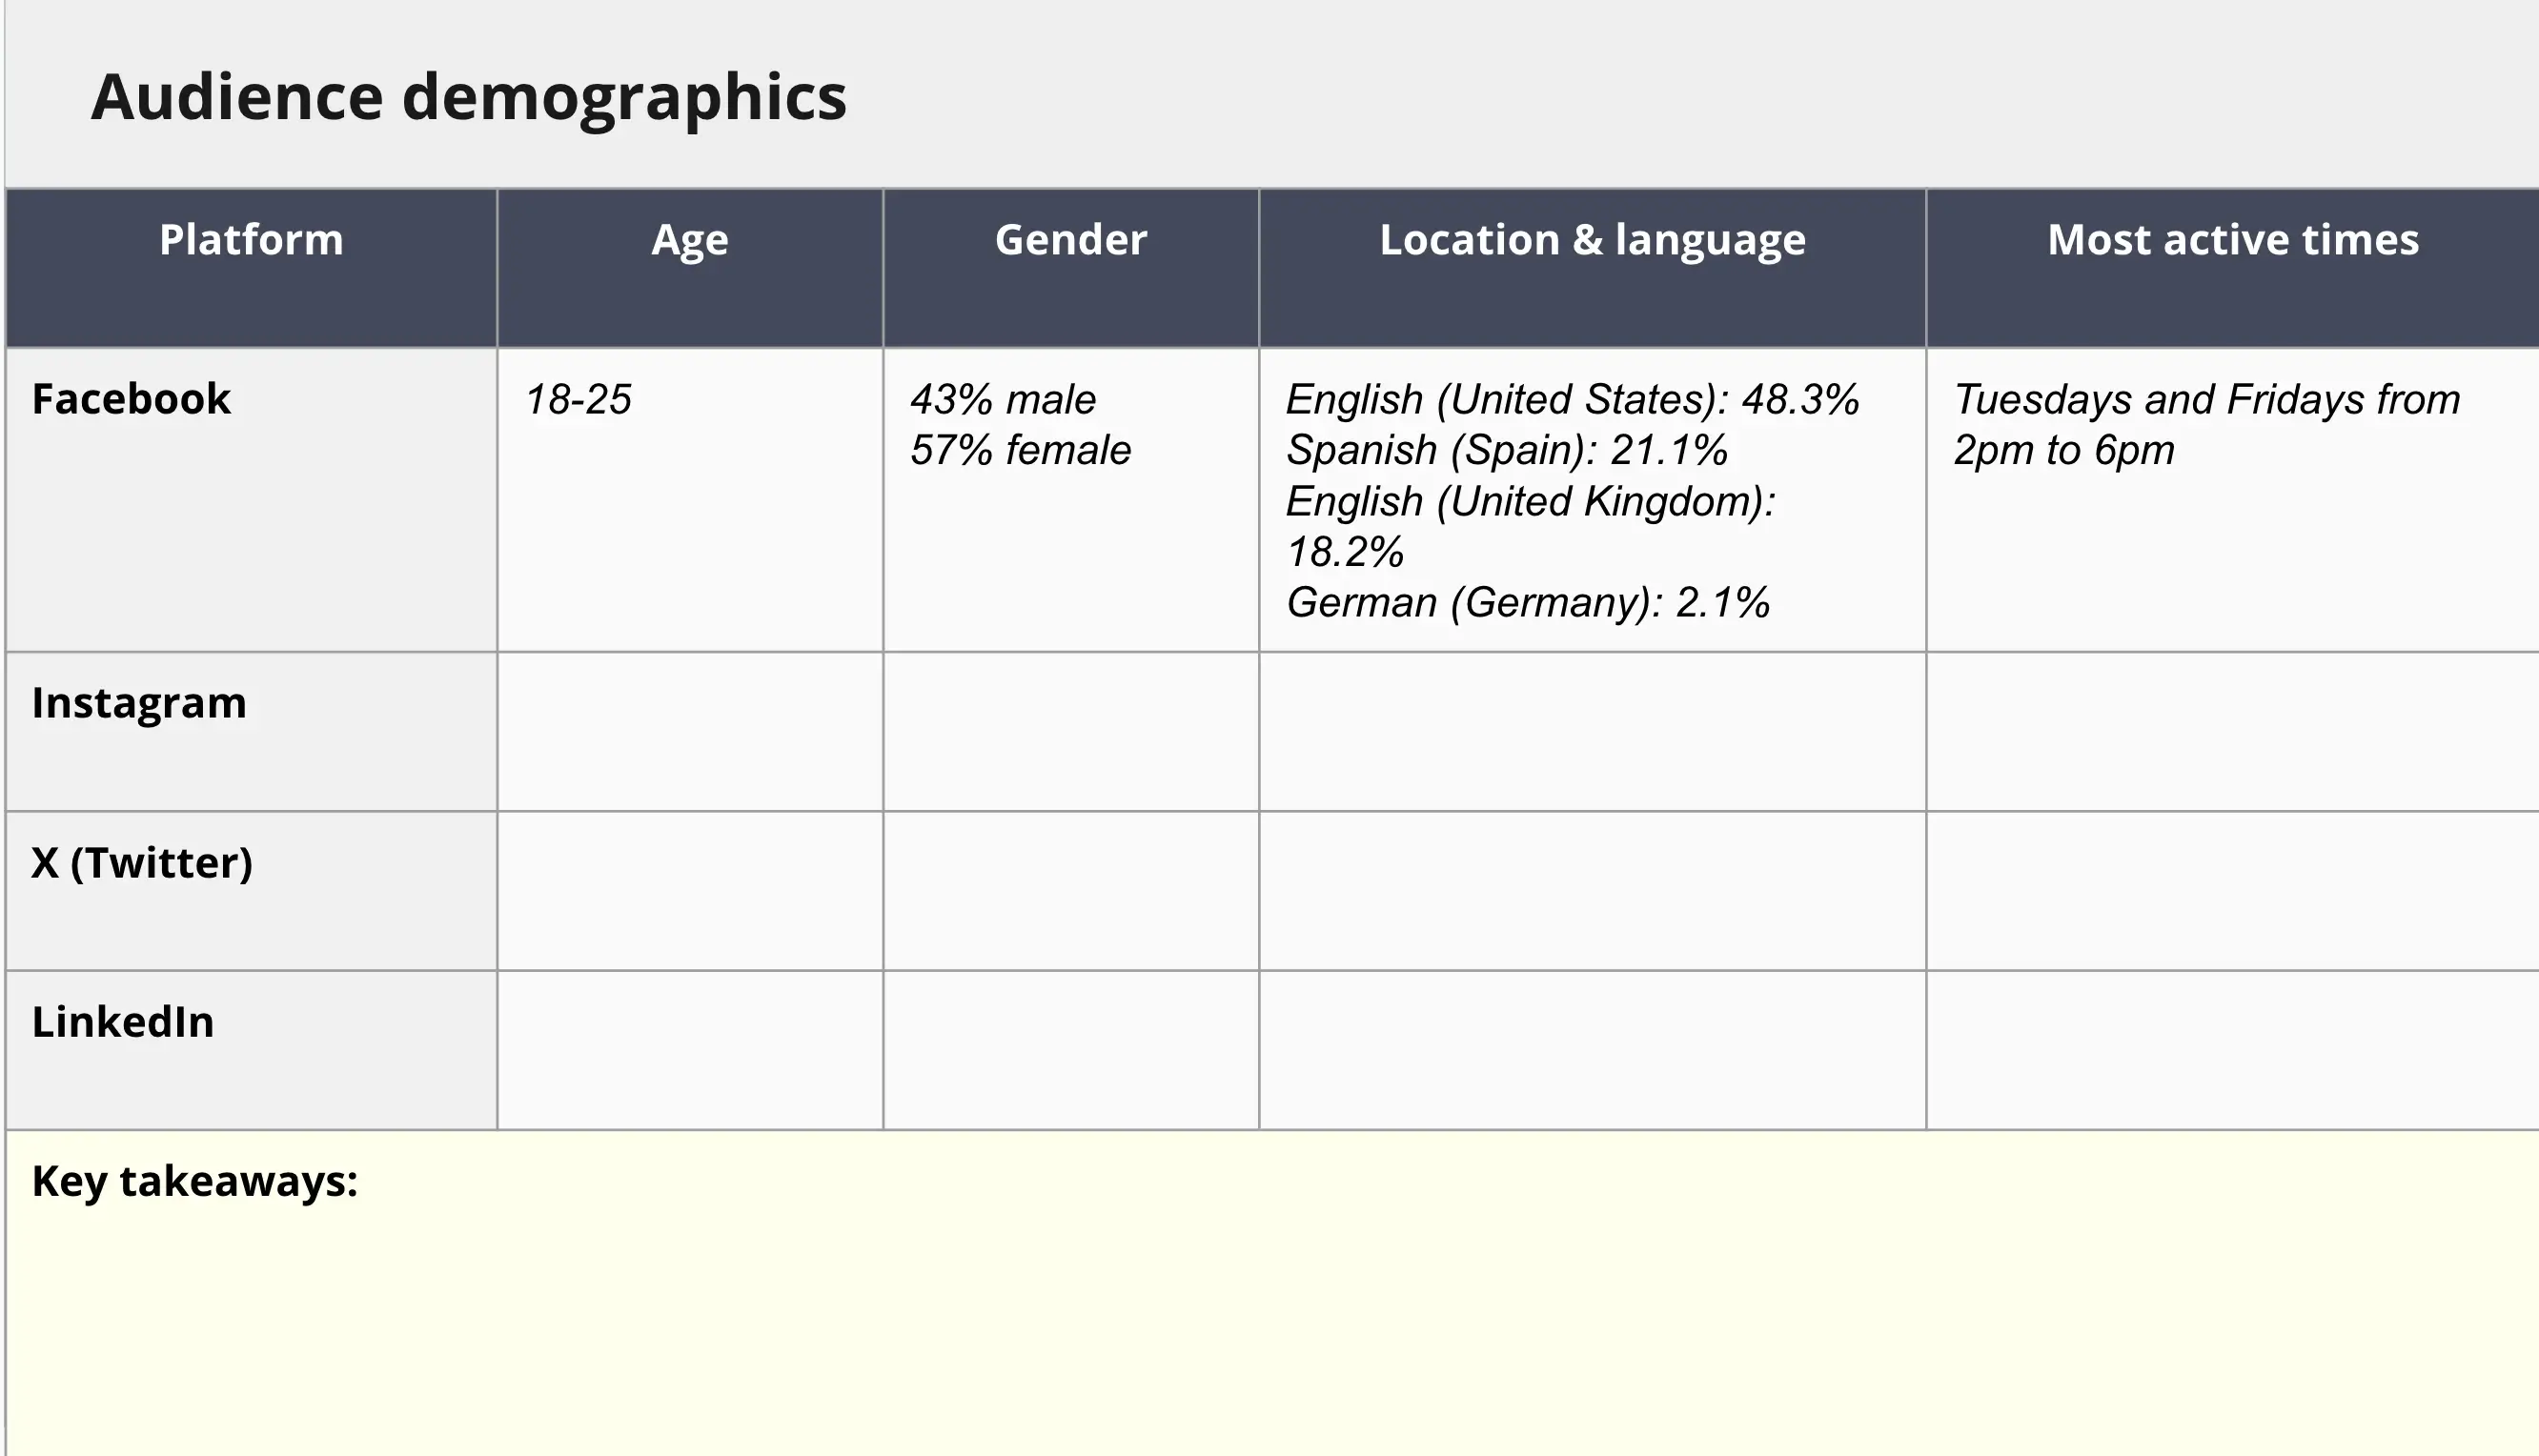
Include:
- Age and gender distribution
- Location and language
- Most active days and times
- Key audience behaviors
Audience demographics data ensures your social media posts align with the people you want to reach.
7. Objectives check-in
After reviewing account and post performance, revisit your business goals and key performance indicators.
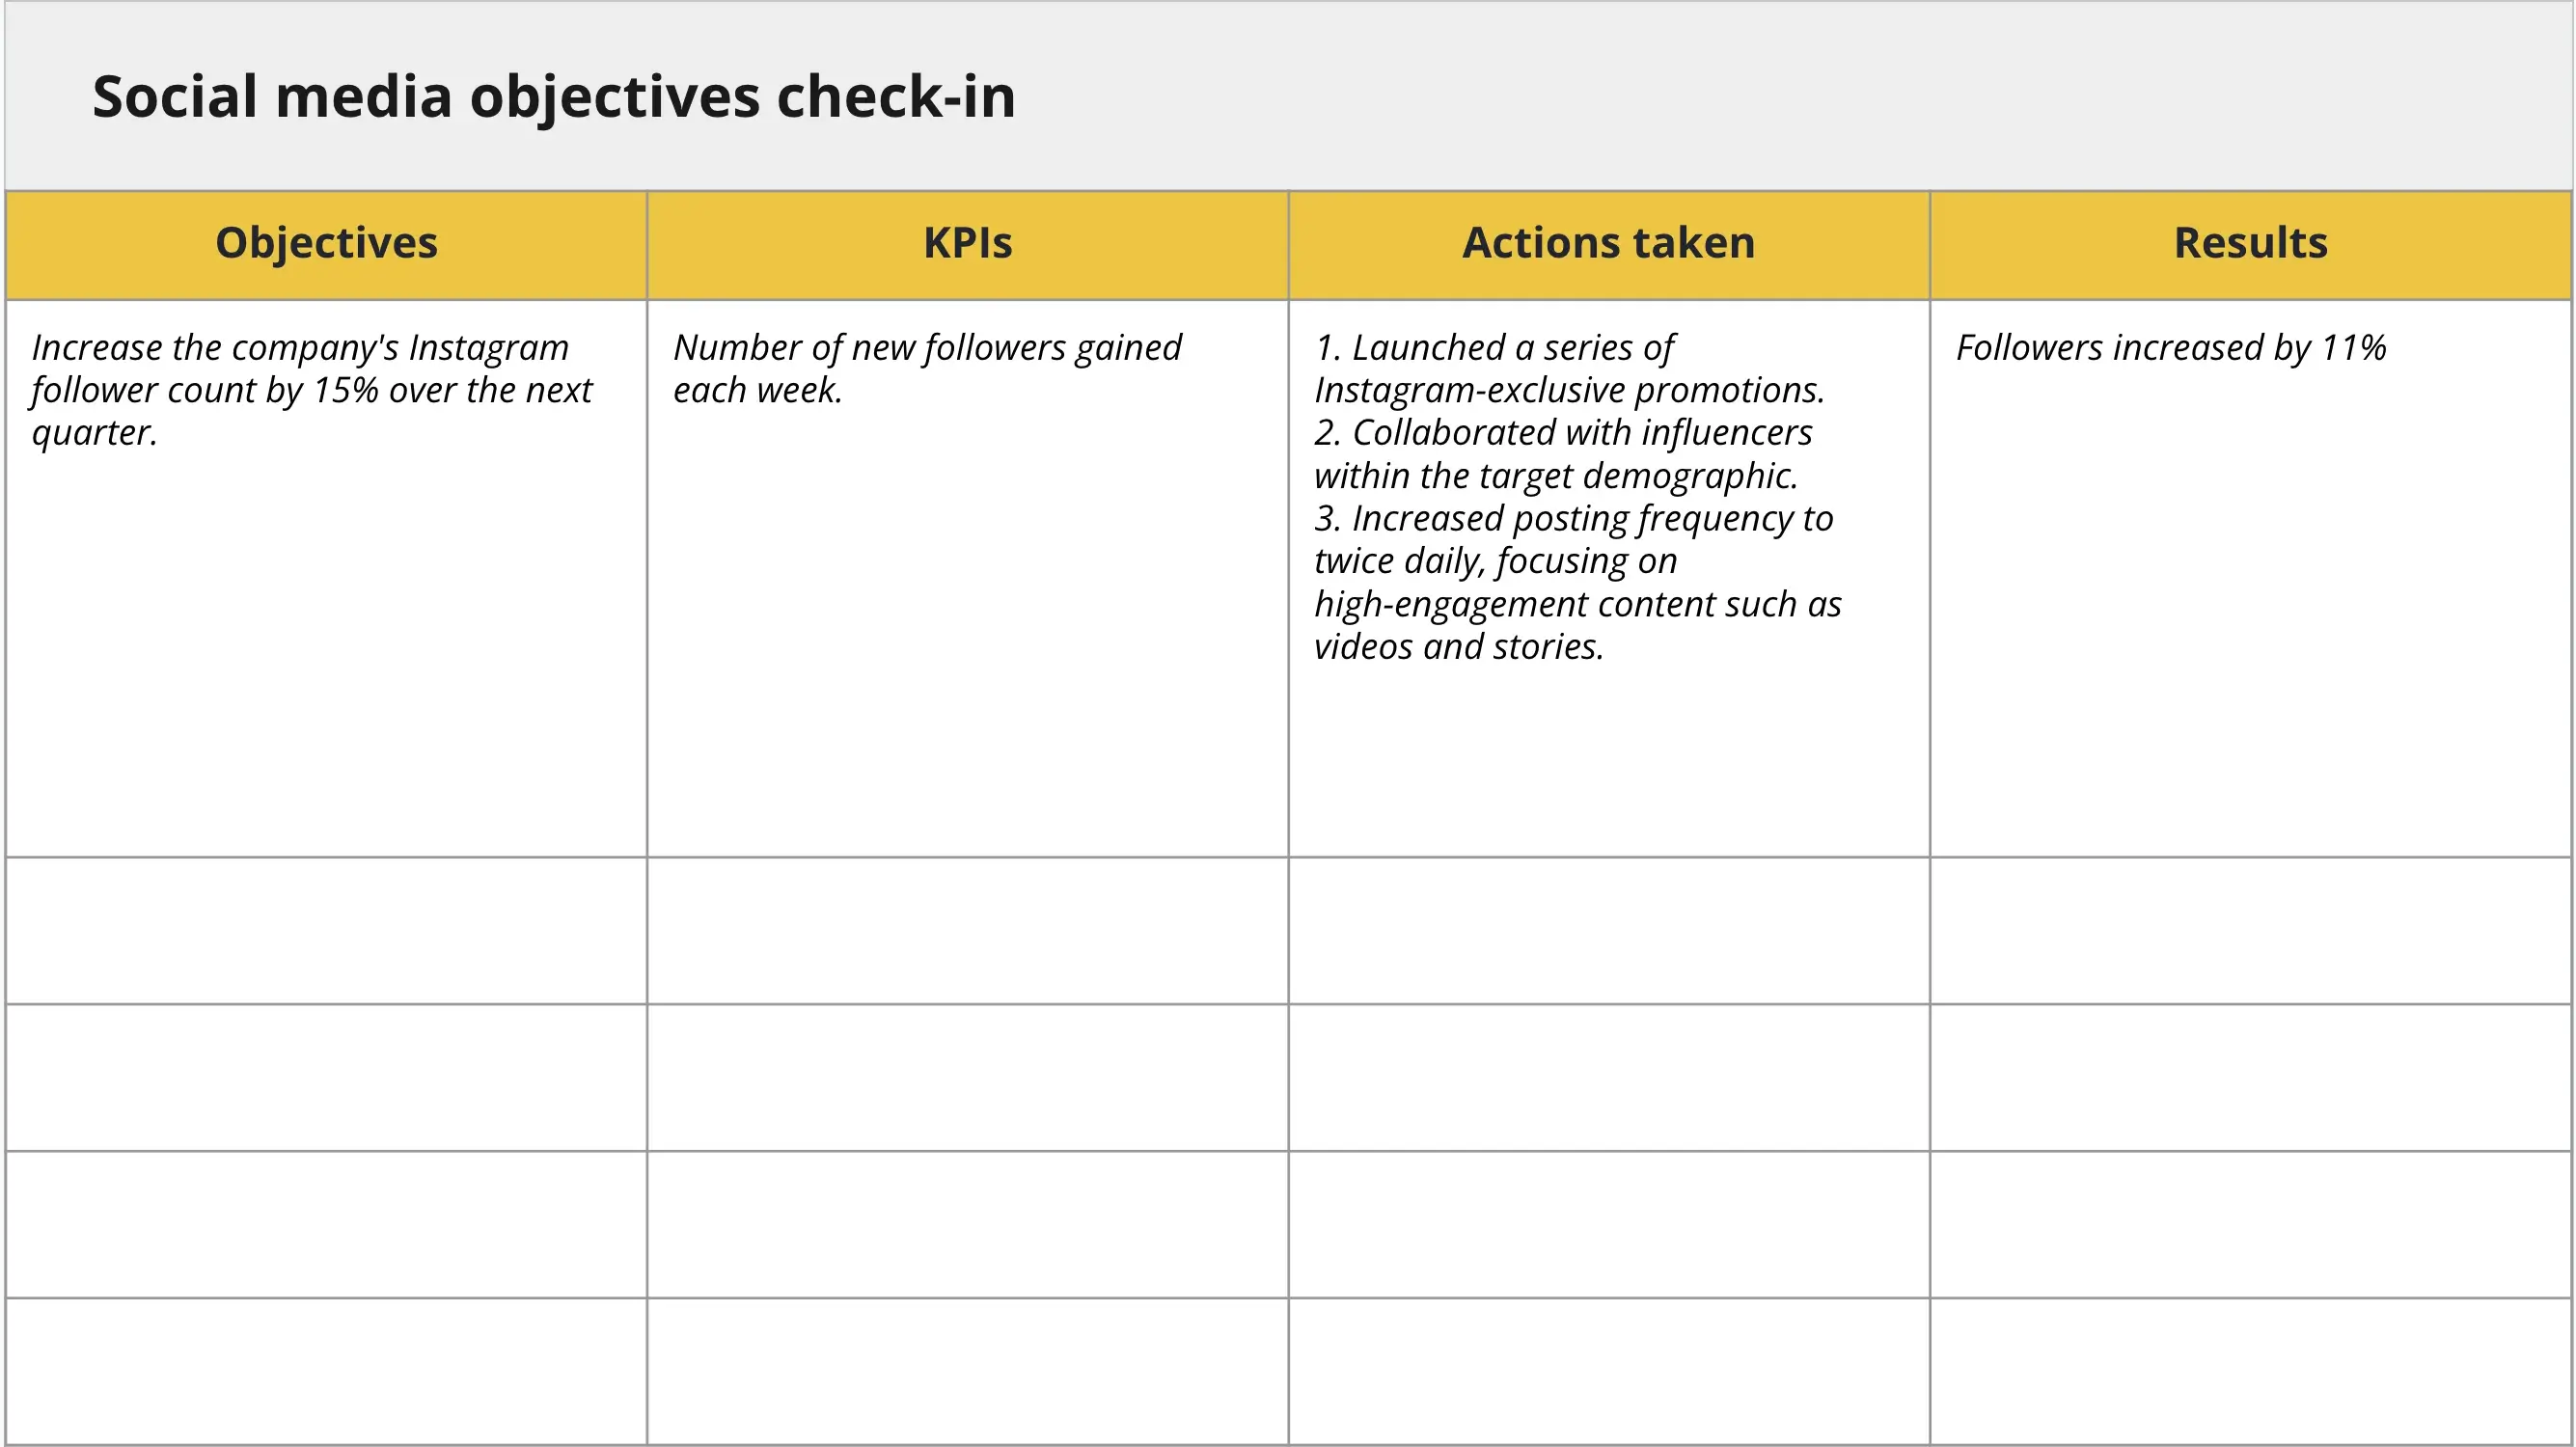
For each objective, outline:
- The KPI you tracked
- Actions taken
- Results achieved
This section connects relevant metrics directly to business objectives and keeps your social media management aligned with your overall marketing strategy.
8. Key takeaways and action items
End your report with clarity.
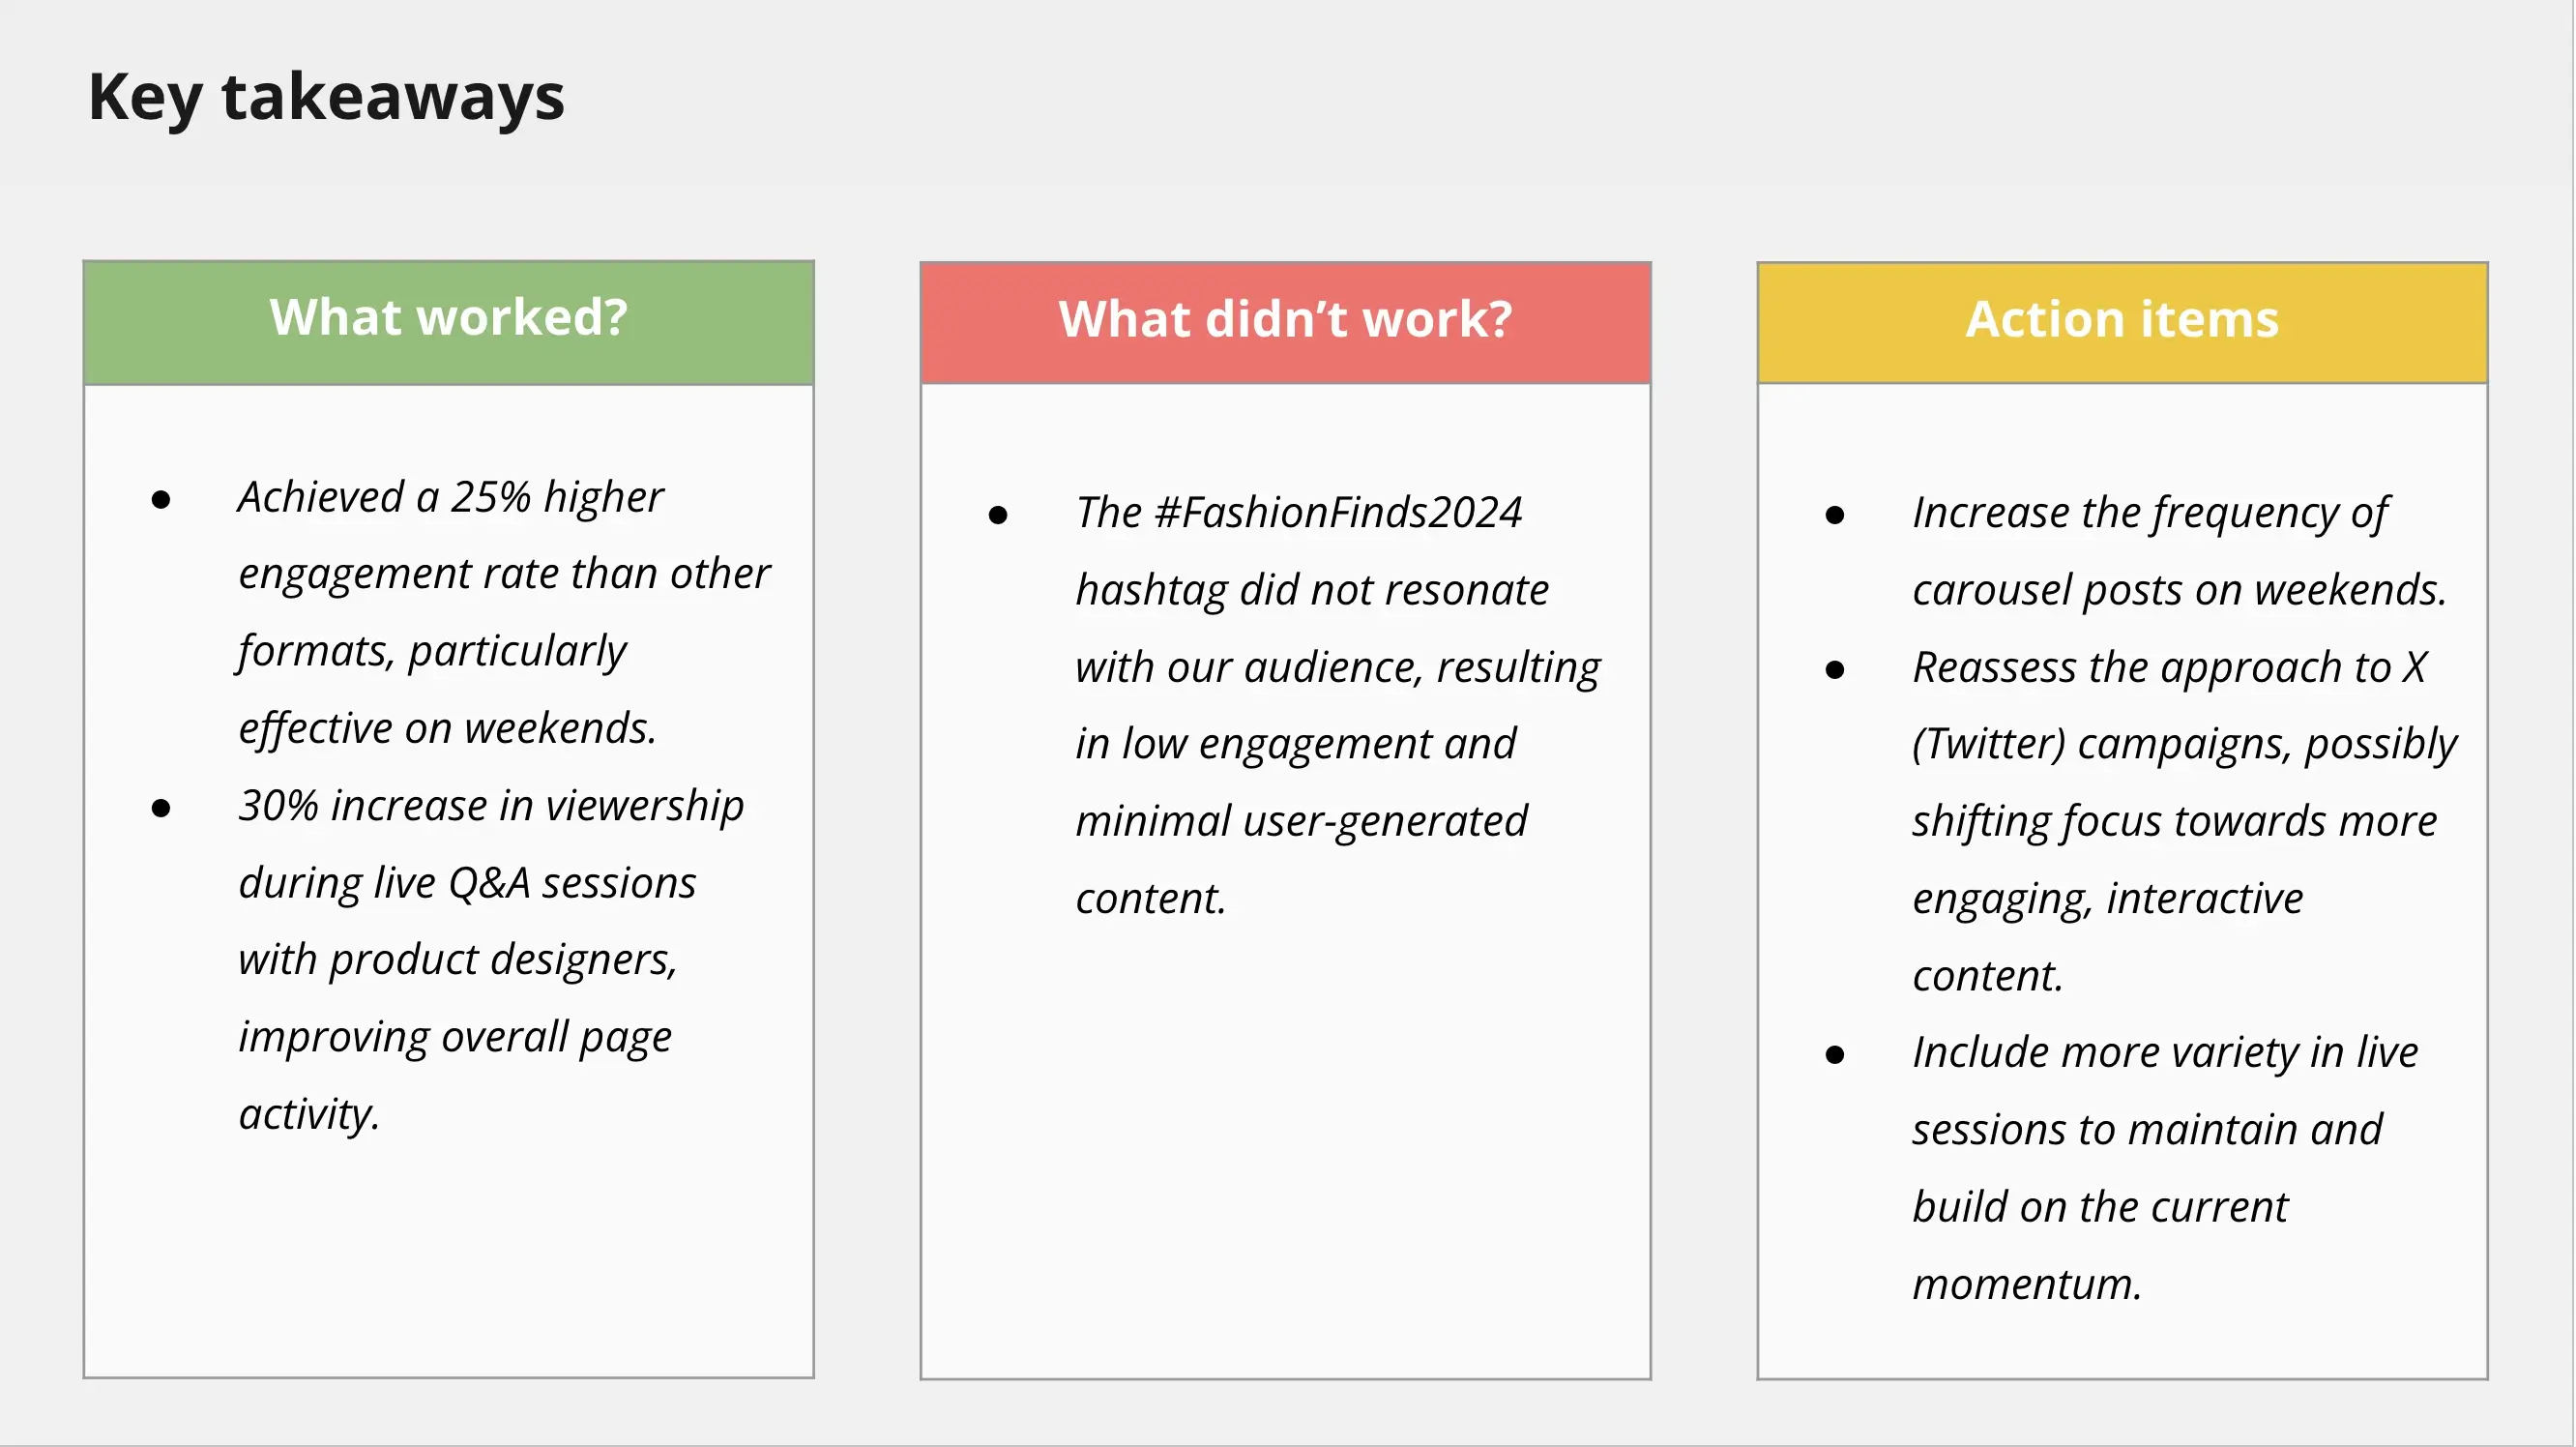
Summarize:
- What worked
- What did not work
- Specific next steps
If your report ends without recommendations, it’s just historical data collection. A strong conclusion turns social media analytics into valuable insights that will help you improve future performance.
How to create a social media report from scratch
Building a social media report from scratch can feel like a lot at first. But once you know what to focus on and why, the process becomes straightforward. All you need is to properly structure your data in Google Docs, Google Slides, or any other document type you want to use.
Here’s how to build a report that actually helps you improve your social media strategy instead of just documenting numbers.
1. Consider your social media goals
Before pulling any social media data, decide what you’re trying to achieve.
Are you aiming to increase brand awareness? Drive website traffic? Generate leads? Improve customer service response time? Increase engagement rate?
Keep it simple. Choose one primary goal and one secondary goal for the quarter. When everything is a priority, nothing really is.
Make your goals measurable. Instead of saying “increase engagement,” define what that means. Do you want 25 percent more comments? A 15 percent increase in engagement rate? A higher conversion rate from social campaigns?
Clear targets make your social media reporting easier to structure and your results easier to evaluate.
2. Identify key performance indicators
Once your goals are clear, choose the key performance indicators that reflect them.
If you are focused on brand awareness, track reach, impressions, follower growth, and share of voice. If your priority is lead generation, focus on click-through rate, conversions, traffic to website, and cost per acquisition.
Stick to three to five key custom metrics per goal. If your report lists 20 different performance metrics, the important ones will get lost.
Balance visibility metrics with outcome-driven metrics. Follower count and impressions show reach. Conversions and revenue attribution show business impact. Both matter, but each should serve a purpose.
Before adding any metric to your report, ask yourself: If this number changes, what decision would I make?
If you cannot answer that clearly, it may not belong in your report.